
Romania's perspective on how the ECL of the local banks were affected by the macroeconomic difficulties
14 december 2022
Romania's perspective on how the expected credit losses (ECL) of the local banks were affected by the macroeconomic difficulties and the ongoing global crises
Romania's perspective on how the expected credit losses (ECL) of the local banks were affected by the macroeconomic difficulties and the ongoing global crises
Executive summary
Based on a sample comprising the largest 10 Romanian banks (as per their consolidated total assets amount at Dec-2021), we have analysed the evolution of the ECL allowance[1] (expected credit loss provisions balance), ECL coverage ratio (expected credit loss coverage ratio) and its allocation between stages[2] for loans and advances granted to customers, in the YE 2019 – H1 2022 period[3].
Overall, when we analyse the expected credit loss coverage ratio, in the wake of the pandemic shock, we note an increase of the median, from YE 2019 (4.4%) to YE 2020 (5%) of 0.6 b.p, the ratio levelling out at around 5% at YE 2020 and YE 2021 for the largest 10 Romanian banks. Whereas data for H1 2022 is rather limited (only four banks of our selection provided such interim data for the first half of 2022), evidence shows that the banks continued to steadily increase the ECL loans coverage ratio up to a median of 5.5%.
Concerning the allocation of gross loans and advances granted to customers per Stages (classification of loans based on credit risk with Stage 1 low credit risk and Stage 3 significant credit risk) our analysis shows a sustained increase by approximately 6 b.p. of the weight of Stage 2 (increased credit risk) exposures from YE 2019 (12%) to YE 2020 (18%) and YE 2021 (17.4%). This increase is offset by a decrease of Stage 1 exposures and a constant level of Stage 3 (significant credit risk) loans and advances granted to customers.
In respect of expected credit loss provisions balance, as expected given the evolution of the exposures, Stage 2 ECL soars by approximately 10 b.p. reaching in YE 2020 and YE 2021, 28% and 29%, respectively. Stage 1 ECL shows a slight increase of approximately 2 b.p. over the analyzed period whereas Stage 3 ECL decrease by approximately 9 b.p. from YE 2019 (62%) to YE 2021 (53%).
In the light of the 2022 unparalleled instability environment, inflationary pressures, and the war in Ukraine, it will be, without doubt, interesting to see the evolution of the credit risk quantification by banks
Analysis
As per the consolidated financial statements details, the stock of ECL allowances increased,in the wake of the pandemic shock at YE 2020 vs YE 2019, by a median of 18%. In the following period, YE 2021 vs YE 2020 , in the context of a more optimistic macroeconomic context and high market liquidity as COVID-19 pressures eased, preceding the breakout of the war in Ukraine banks have known a more moderate augmentation (7% median). Interestingly, although the gross exposure increased, we note three banks showing a decrease in their ECL allowances balance and a net ECL release. The decrease range goes from -7% to -2%. We should also highlight that, two banks, presented an increase of more than 20% of the ECL allowance ratio.
Despite the economic challenges, the ECL allowance balance continued to increase at H1 2022 vs. YE 2021, with a 5% median increase.
As shown in Graph 1, in terms of allocation of the loans gross carrying amount per stages, during the analysed period, we note that the weighted average of the proportion of Stage 2 exposures increased starting with YE 2020 (18% of exposures vs. 12% at YE 2019) levelling out at YE 2021 to 17.4%. At H1 2022, for the 4 banks for which information was available, the ratio slightly increased with 1 b.p. and reached 20.4%. This increase in Stage 2 is offset by a decrease of Stage 1 credits during YE 2019 to H1 2022, whereas Stage 3 credits remain quite stable (approx. 5% weighted average ratio).
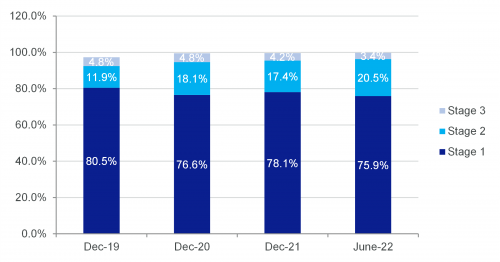
Graph 1: Allocation of AC loans gross carrying amount to customers per Stages
As it can be seen in Graph 2, in terms of allocation of the ECL allowance per stages, during the analysed period, we would like to highlight that the weighted average of the proportion of Stage 2 ECL balance vs. total ECL balance increased starting with YE 2020 (28% vs. 18% at YE 2019) levelling out at YE 2021 to 29.4%. At H1 2022, for the 4 banks for which information was available, the ratio increased with almost 6 b.p reaching 35%. This increase in Stage 2 ECL allowance is partially offset by a constant decrease of Stage 3 credits during YE 2019 to H1 2022 (from 62% at YE 2019 to 53% at YE 2021 and then, 45% at H1 2022). Stage 1 ECL allowance during the same period slightly increases from 13% at YE 2019 to 16% at YE 2021.
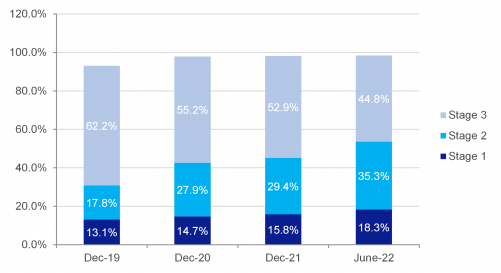
Graph 2: Allocation of ECL per Stages
Such evolutions of the ECL allowance were mainly driven by the increased ambiguity in the Covid-19 context and the perceived decrease in borrowers’ resilience. Although by the end of 2021, it was clear that the expected wave of defaults was not materializing, the weight of Stage 2 was kept relatively stable (17% of exposures and 29% of ECL allowance).
As mentioned previously, the median ECL coverage ratio of loans and advances to customers increased from 4.4% at YE 2019 up to 5% at YE 2020. While at YE 2021 the median decrease was only marginal to 4.9%.
Moreover, we captured a gap between the provisioning behaviour of larger banks and smaller banks. The top four larger banks of our sample (capturing about two thirds of the total assets of our sample) have proven to have a more prudent approach in provisioning during this period, increasing their loans coverage ratio by 0.9 % at YE 2020 vs YE 2019, whereas smaller banks augmentation was of only 0.5%. Similarly, by the end of 2021, larger banks decreased their ratios up to a 5.7% median, still 0.3% above the 2019 pre Covid -19 level, whereas smaller banks reduction at Dec-21 reached 4%, a level similar to the YE 2019 ratio.
In terms of distribution per stages of the ECL coverage ratio, the evolution of Stage 1, Stage 2 and Stage 3 coverage ratios was similar to the one of the global ECL ratio, increasing in the Covid-19 context at YE 2020 vs YE 2019 for all stages (0.8% median value at YE 2020 for Stage 1 vs 0.5% at YE 2019, 8.3% median value for Stage 2 at YE 2020 vs 5.9% at YE 2019 and 66.7% median value for Stage 3 at YE 2020 vs. 60.4% at YE 2019), with a much stepper augmentation in the case of Stage 2 and Stage 3 ratios.
Nevertheless, although by the end of 2021, the Stage 1 coverage ratios remained relatively stable, the Stage 2 coverage ratios decreased compared to previous period (7.7% at YE 2021), whereas changes in the Stage 3 loan coverage ratio varied from one bank to another, with a decreasing tendency from larger banks.
As per information disclosed in their interim financial statements for H1 2022, while direct exposure to Russia is not significant, banks are planning to remain vigilant in the light of the unstable current macroeconomic context, driven by inflationary pressures, high energy prices and supply chain driven constraints.
[1] ECL allowance also includes POCI (Purchased or Originated Credit Impaired) lines.
[2] Stage 1: Low Credit Risk; Stage 2: Increased Credit Risk; Stage 3: Significant Credit Risk.
[3] H1 2022 consolidated information related to ECL allowance was available only for 4 banks (including top 3 largest banks) out of the top 10 selected.
Contact

Anca Mihuț Senior Supervisor, Financial Advisory Bucharest